
Dozzle: Real-Time Docker Log Viewer with a Beautiful Web UI
If you've ever SSH'd into a server and typed docker logs -f container_name while squinting at a terminal full of scrolling text, you know the pain of Docker log management. It works for quick debugging, but it falls apart when you need to search across multiple containers, filter by log level, or monitor several services at once. The standard answer is to set up a full ELK stack (Elasticsearch, Logstash, Kibana) or Loki + Grafana, but those are serious infrastructure investments for what might be a simple "let me see what my containers are doing" need.
Photo by Erik Mclean on Unsplash
Dozzle is a lightweight, real-time Docker log viewer that runs as a single container with zero configuration. No databases, no agents, no complex pipelines. It connects to the Docker socket, reads container logs, and presents them in a clean web interface with real-time streaming, filtering, regex search, and multi-container views. It uses almost no resources -- typically under 30 MB of RAM.
Why Dozzle
The Docker logging ecosystem ranges from "just use the CLI" to "deploy a 5-service observability stack." Dozzle sits in the practical middle:
- Zero configuration -- Mount the Docker socket and you're done. No config files, no databases, no setup wizards.
- Real-time streaming -- Logs stream live in the browser. No polling, no delays.
- Extremely lightweight -- Under 30 MB RAM, single static binary, no external dependencies.
- Multi-container view -- View logs from multiple containers side by side in a single screen.
- Regex filtering -- Filter logs with full regex support while streaming.
- Log level detection -- Automatically detects and color-codes log levels (INFO, WARN, ERROR, DEBUG).
- Docker Compose grouping -- Automatically groups containers by their Compose project.
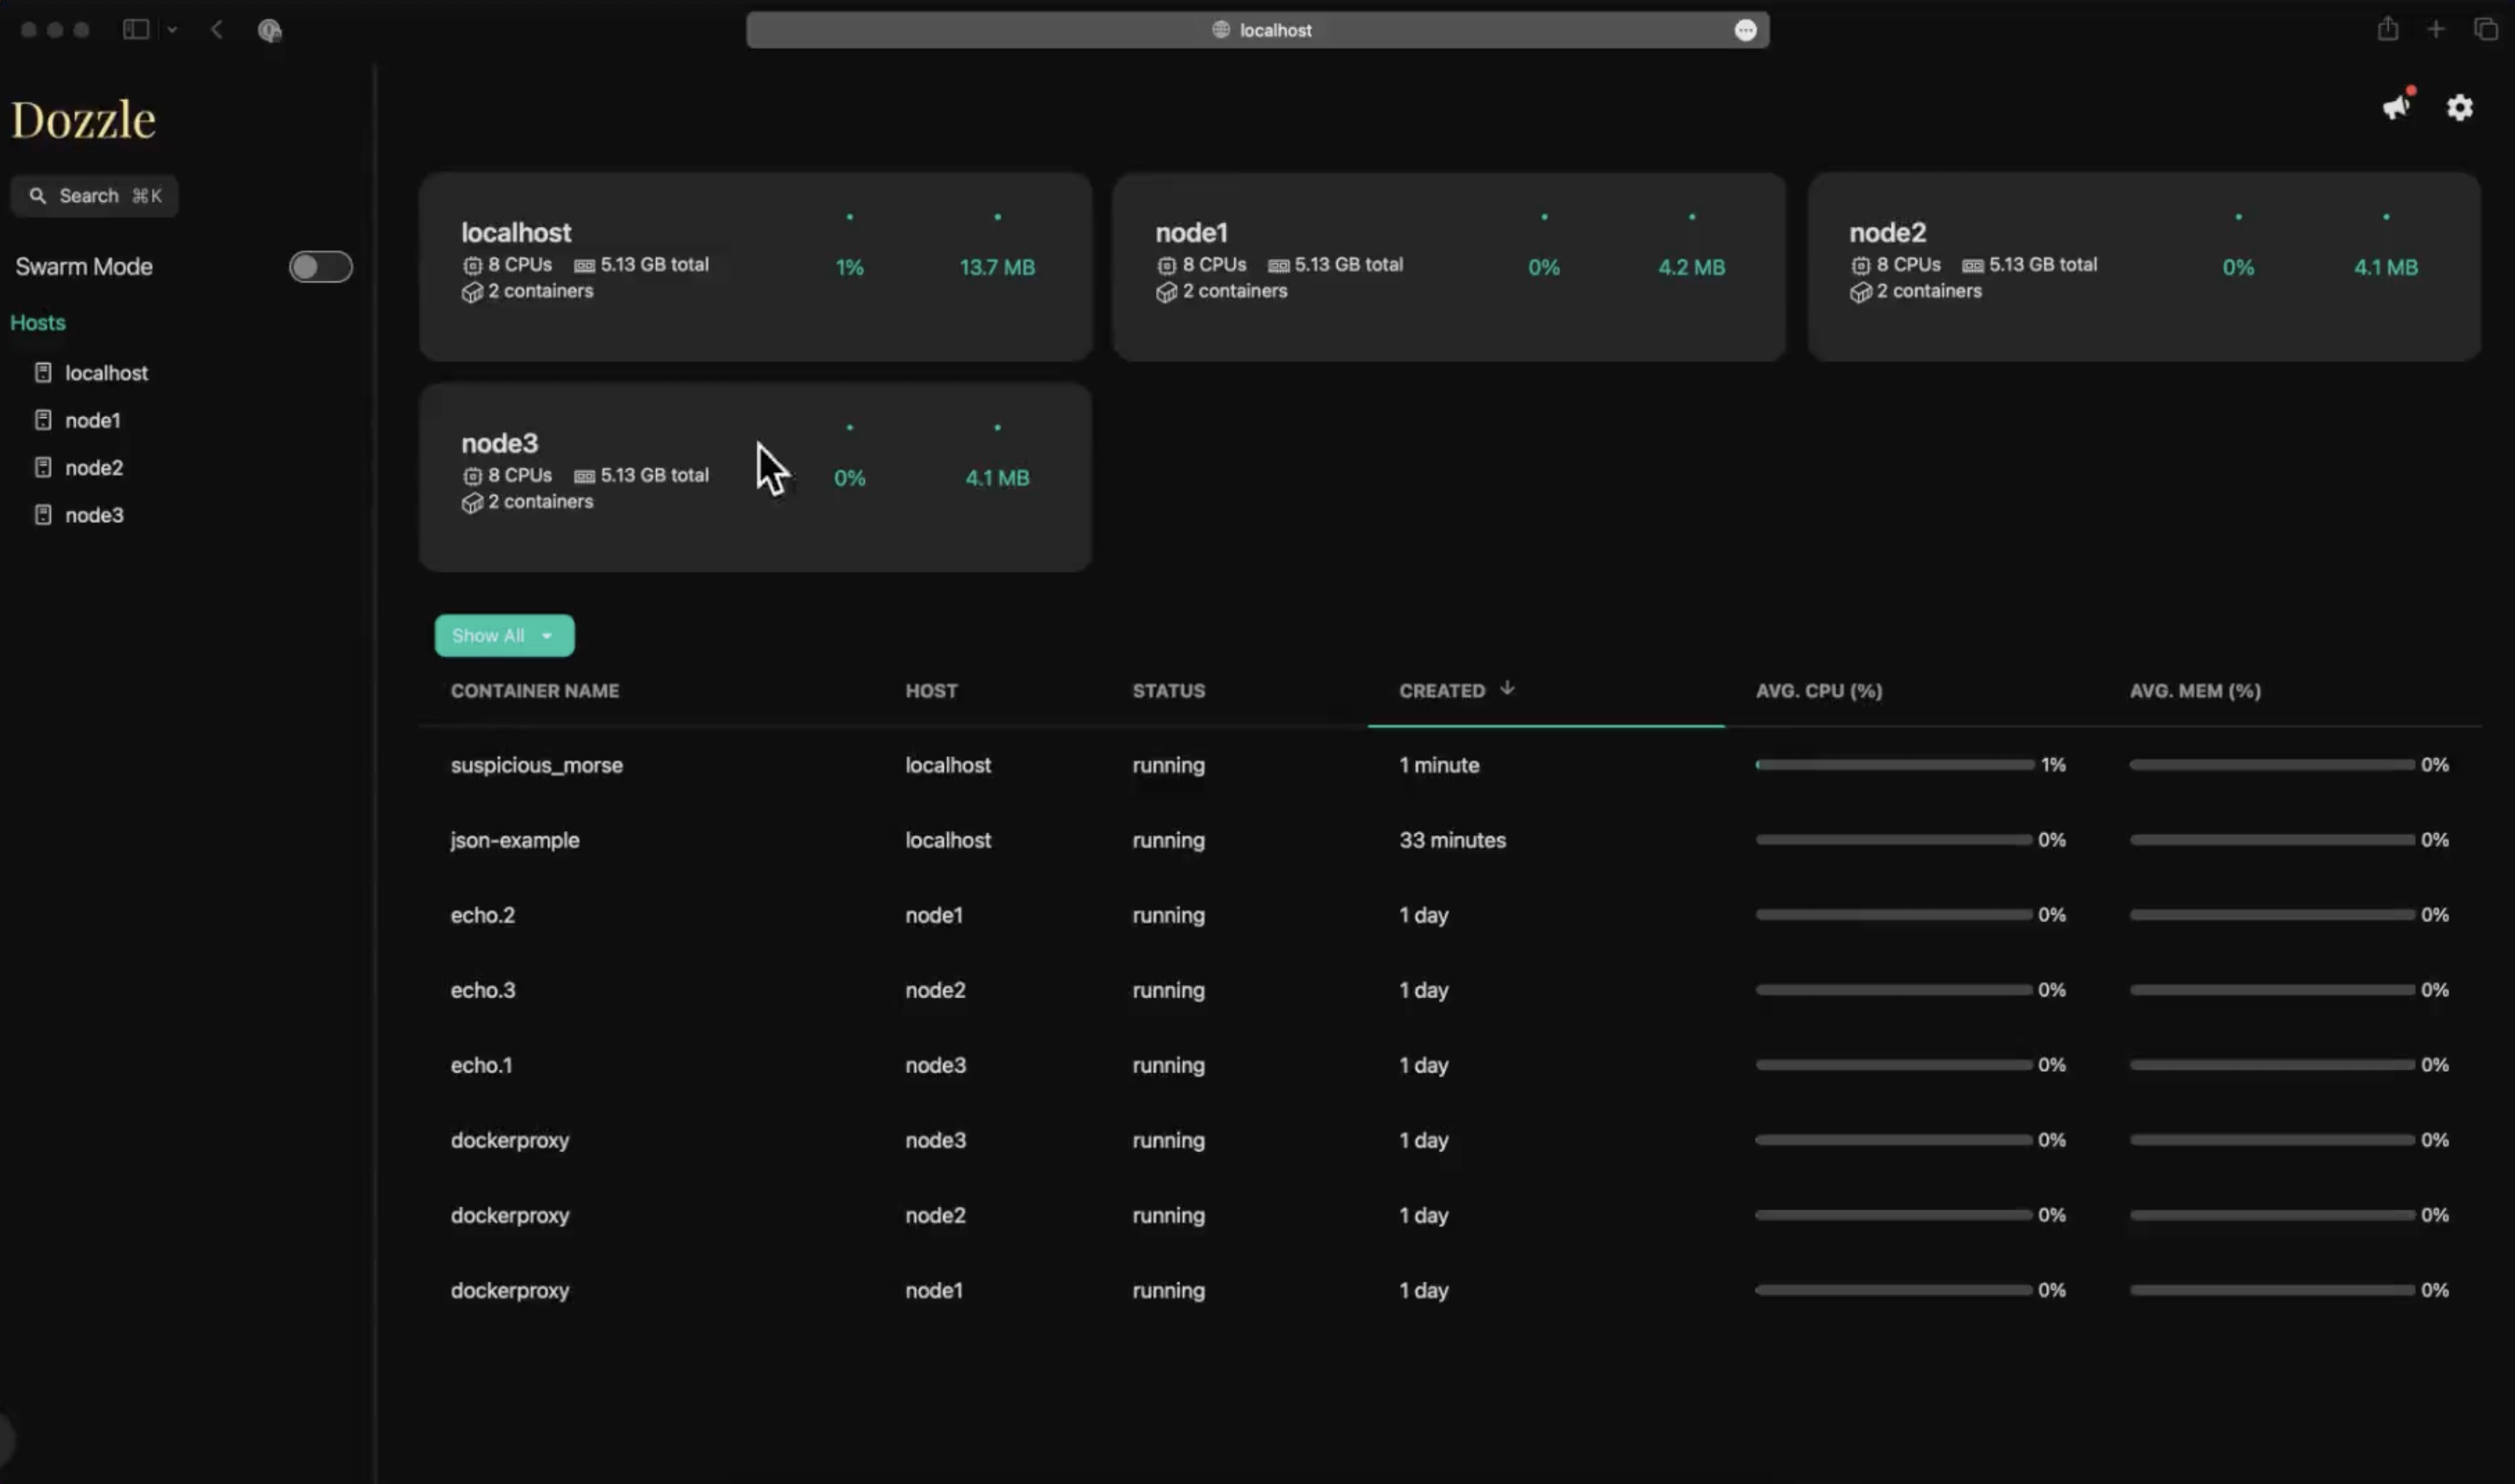
- Multi-host support -- Monitor containers across multiple Docker hosts from a single Dozzle instance.
- No data storage -- Dozzle doesn't store any log data. It reads directly from Docker's log driver. This means zero disk usage and no data retention concerns.
When Dozzle Is the Right Choice
Use Dozzle when:
- You want to quickly see what your containers are doing right now
- You're debugging issues across a few services
- You need a visual interface for log monitoring during development
- You want something running in minutes, not hours
- You don't need long-term log retention or complex analytics
Use a full logging stack (Loki/ELK) when:
- You need to query historical logs from weeks or months ago
- You require log aggregation across hundreds of containers
- You need alerting based on log patterns
- Compliance requires log retention and immutability
- You're running a production system where log analysis is critical
Many people run both: Dozzle for quick, real-time viewing and Loki/Grafana for long-term analysis and alerting.
Docker Setup
Dozzle's setup is about as simple as Docker gets:
# docker-compose.yml
services:
  dozzle:
    image: amir20/dozzle:latest
    container_name: dozzle
    ports:
      - "8080:8080"
    volumes:
      - /var/run/docker.sock:/var/run/docker.sock:ro
    environment:
      - DOZZLE_LEVEL=info
      - DOZZLE_TAILSIZE=300
    restart: unless-stopped
docker compose up -d
That's it. Navigate to http://your-server:8080 and you'll see all your running containers with their logs streaming in real time.
The :ro (read-only) flag on the Docker socket mount is important -- Dozzle only needs to read container information and logs, never to modify anything.
![]()
Key Configuration Options
Dozzle is configured entirely through environment variables:
Display Settings
environment:
  # Number of log lines to load initially when opening a container
  - DOZZLE_TAILSIZE=300

  # Minimum log level to display (debug, info, warn, error)
  - DOZZLE_LEVEL=info

  # Enable or disable the container stats (CPU, memory) in the sidebar
  - DOZZLE_NO_ANALYTICS=false
Filtering and Search
Once you open a container's logs in the Dozzle UI, you get powerful filtering capabilities:
- Text search -- Type in the search bar to filter logs in real time. Only matching lines are shown while the stream continues.
- Regex mode -- Toggle regex mode for complex patterns like
ERROR|WARN|FATALorrequest.*timeout. - Log level filter -- Click the level badges (INFO, WARN, ERROR) to show/hide specific levels.
- Time range -- Jump to specific timestamps or filter by relative time ranges.
All filtering happens client-side on the streaming data, so there's no server-side processing overhead.
Container Selection
The left sidebar shows all containers organized by:
- Running status -- Active containers are shown first
- Compose project -- Containers from the same
docker-compose.ymlare grouped together - Custom groups -- You can define custom groups via labels
To create custom groups, add labels to your containers:
services:
  my-app:
    image: my-app:latest
    labels:
      - "dozzle.group=production"
Want more monitoring guides? Get guides like this in your inbox — Self-Hosted Weekly delivers one free deep-dive every week.
Multi-Host Monitoring
Dozzle can monitor containers across multiple Docker hosts, which is invaluable if you run services across several servers. There are two approaches:
Method 1: Remote Docker Hosts via TCP
If your Docker daemons expose a TCP socket (with TLS), configure Dozzle to connect to them:
# docker-compose.yml
services:
  dozzle:
    image: amir20/dozzle:latest
    container_name: dozzle
    ports:
      - "8080:8080"
    volumes:
      - /var/run/docker.sock:/var/run/docker.sock:ro
      - /path/to/certs:/certs:ro
    environment:
      - DOZZLE_REMOTE_HOST=tcp://server2.local:2376|server2,tcp://server3.local:2376|server3
    restart: unless-stopped
The format is tcp://host:port|display-name. Each remote host appears in the sidebar with its own container list.
Method 2: Dozzle Agent
For environments where exposing the Docker TCP socket is not desirable, Dozzle provides a lightweight agent that runs on each remote host:
On the remote host:
# docker-compose.yml (on remote host)
services:
  dozzle-agent:
    image: amir20/dozzle:latest
    container_name: dozzle-agent
    command: agent
    ports:
      - "7007:7007"
    volumes:
      - /var/run/docker.sock:/var/run/docker.sock:ro
    restart: unless-stopped
On your main Dozzle host:
# docker-compose.yml (on main host)
services:
  dozzle:
    image: amir20/dozzle:latest
    container_name: dozzle
    ports:
      - "8080:8080"
    volumes:
      - /var/run/docker.sock:/var/run/docker.sock:ro
    environment:
      - DOZZLE_REMOTE_AGENT=agent1:server2.local:7007,agent2:server3.local:7007
    restart: unless-stopped
The agent approach is more secure because you don't need to expose the Docker TCP socket, and the agent only provides log data -- no container management capabilities.
Authentication
By default, Dozzle has no authentication -- anyone who can reach the port can view your container logs. For production use, you should add authentication. Dozzle supports a built-in simple auth system:
File-Based Authentication
Create a users.yml file:
# users.yml
users:
  admin:
    password: "$2a$10$..."  # bcrypt hash
    name: "Admin"
    email: [email protected]
Generate a bcrypt hash for your password:
docker run --rm httpd:2.4-alpine htpasswd -nbB "" "your-password" | cut -d: -f2
Mount the users file:
services:
  dozzle:
    image: amir20/dozzle:latest
    volumes:
      - /var/run/docker.sock:/var/run/docker.sock:ro
      - ./users.yml:/data/users.yml
    environment:
      - DOZZLE_AUTH_PROVIDER=simple
    ports:
      - "8080:8080"
    restart: unless-stopped
Forward Auth (Authelia, Authentik, etc.)
If you're using a single sign-on solution, Dozzle supports forward proxy authentication:
environment:
  - DOZZLE_AUTH_PROVIDER=forward-proxy
  - DOZZLE_AUTH_HEADER_USER=Remote-User
  - DOZZLE_AUTH_HEADER_EMAIL=Remote-Email
  - DOZZLE_AUTH_HEADER_NAME=Remote-Name
This integrates with reverse proxies that inject user headers after authentication (Traefik + Authelia, Nginx + Authentik, Caddy + forward_auth, etc.).
Reverse Proxy Configuration
Caddy
dozzle.yourdomain.com {
    reverse_proxy dozzle:8080
}
Nginx
server {
    listen 443 ssl;
    server_name dozzle.yourdomain.com;

    ssl_certificate /path/to/cert.pem;
    ssl_certificate_key /path/to/key.pem;

    location / {
        proxy_pass http://localhost:8080;
        proxy_http_version 1.1;
        proxy_set_header Upgrade $http_upgrade;
        proxy_set_header Connection "upgrade";
        proxy_set_header Host $host;
        proxy_set_header X-Real-IP $remote_addr;
        proxy_set_header X-Forwarded-For $proxy_add_x_forwarded_for;
        proxy_set_header X-Forwarded-Proto $scheme;
    }
}
The Upgrade and Connection headers are essential -- Dozzle uses WebSockets for real-time log streaming.
Traefik
services:
  dozzle:
    image: amir20/dozzle:latest
    labels:
      - "traefik.enable=true"
      - "traefik.http.routers.dozzle.rule=Host(`dozzle.yourdomain.com`)"
      - "traefik.http.routers.dozzle.entrypoints=websecure"
      - "traefik.http.routers.dozzle.tls.certresolver=letsencrypt"
      - "traefik.http.services.dozzle.loadbalancer.server.port=8080"
    volumes:
      - /var/run/docker.sock:/var/run/docker.sock:ro
    restart: unless-stopped
Merged Log View
One of Dozzle's most useful features is the merged log view, which combines logs from multiple containers into a single chronological stream. This is invaluable for debugging issues that span services -- for example, tracking a request from your reverse proxy through your API server to your database.
To use it:
- Select multiple containers from the sidebar (hold Ctrl/Cmd and click)
- Click the "Merged" button that appears
- Logs from all selected containers are interleaved by timestamp
Each container's logs are color-coded, so you can visually track which service produced which log line. Combined with regex filtering, this lets you follow a request ID or correlation token across your entire stack in real time.
Docker Compose Log Grouping
If you use Docker Compose, Dozzle automatically groups containers by their Compose project. This makes it easy to view all containers that belong to a single application -- your web server, database, cache, and worker are all grouped together.
Dozzle detects Compose projects using Docker labels that Docker Compose automatically applies (com.docker.compose.project). No additional configuration needed.
Resource Usage and Limitations
Dozzle is impressively lightweight:
- Memory: 15-30 MB RAM depending on the number of connected clients
- CPU: Negligible -- it's just forwarding Docker API responses
- Disk: Zero -- Dozzle stores nothing to disk
- Network: Minimal -- WebSocket connections are efficient
The main limitation is that Dozzle only shows logs from Docker's log driver. If your containers write logs to files inside the container rather than stdout/stderr, Dozzle won't see them. Most modern applications follow the twelve-factor app methodology of logging to stdout, but some legacy applications may need log driver configuration.
Also, since Dozzle doesn't store data, it can only show logs that Docker still has in its log buffer. If your Docker daemon is configured to rotate logs aggressively (common with the json-file driver), older logs won't be available. For long-term retention, you need a dedicated logging solution like Loki or Elasticsearch.
Comparison with Other Log Viewers
| Feature | Dozzle | Portainer Logs | Loki + Grafana | ELK Stack |
|---|---|---|---|---|
| Setup complexity | Trivial | Medium | Medium | High |
| Resource usage | ~30 MB | ~200 MB | ~1 GB+ | ~4 GB+ |
| Real-time streaming | Yes | Yes | Near real-time | Near real-time |
| Full-text search | Regex on stream | Basic | LogQL queries | Lucene queries |
| Multi-host | Yes | Yes (paid) | Yes | Yes |
| Log retention | None (Docker buffer) | None (Docker buffer) | Configurable | Configurable |
| Alerting | No | No | Yes | Yes |
| Dashboards | No | Basic | Full | Full |
Dozzle is not competing with Loki or ELK -- it's complementing them. Use Dozzle as your daily "what's happening right now" tool and a full logging stack for historical analysis and alerting.
Security Considerations
Mounting the Docker socket gives Dozzle access to information about all containers on the host, including environment variables that might contain secrets. While Dozzle mounts the socket read-only, the container metadata it can read may include sensitive environment variables.
To mitigate this:
- Always enable authentication in any non-development environment
- Use a reverse proxy with TLS to encrypt traffic
- Consider Docker socket proxy tools like
tecnativa/docker-socket-proxythat limit which API endpoints are accessible - Restrict network access so only trusted networks can reach Dozzle
For higher security environments, the Docker socket proxy approach lets you expose only the specific Docker API endpoints Dozzle needs:
services:
  docker-proxy:
    image: tecnativa/docker-socket-proxy
    volumes:
      - /var/run/docker.sock:/var/run/docker.sock
    environment:
      - CONTAINERS=1
      - LOGS=1
      - POST=0
    ports:
      - "2375:2375"
    restart: unless-stopped

  dozzle:
    image: amir20/dozzle:latest
    environment:
      - DOCKER_HOST=tcp://docker-proxy:2375
    ports:
      - "8080:8080"
    restart: unless-stopped
Who Should Use Dozzle
Dozzle is for anyone running Docker who wants a quick, visual way to monitor container logs. It's particularly valuable for:
- Home lab operators who run 10-50 containers and want to quickly check on services
- Development teams who need a shared view of container logs during development
- Small production deployments where a full logging stack is overkill
- Anyone debugging Docker Compose stacks where issues span multiple services
The five-minute setup time and zero maintenance overhead make Dozzle an easy recommendation. Even if you eventually deploy a full logging solution, Dozzle remains useful as a quick real-time viewer alongside it.