
Grafana Loki: Self-Hosted Log Aggregation Made Simple
When something goes wrong in your self-hosted stack, logs are the first place you look. But if you're running a dozen containers across a couple of machines, hunting through docker logs and journalctl on each host gets old fast. You need a single place to search all your logs at once.
Photo by Akin Cakiner on Unsplash
Grafana Loki is a log aggregation system designed for exactly this. Built by the team behind Grafana, it takes a fundamentally different approach from traditional logging stacks -- and that difference makes it a perfect fit for homelab and small-scale self-hosted environments.
What Makes Loki Different
The traditional answer to centralized logging is the ELK stack (Elasticsearch, Logstash, Kibana) or Graylog. Both are powerful, but they come with a cost: Elasticsearch indexes the full text of every log line. That means serious RAM and disk usage. A basic ELK deployment wants 4-8 GB of RAM just for Elasticsearch, and storage grows quickly as your index expands.
Loki takes a different path. It indexes only labels (metadata like container name, host, log level), not the log content itself. The actual log lines are stored as compressed chunks. When you search, Loki uses labels to find the right chunks and then greps through them. This design trades some query speed on massive datasets for dramatically lower resource usage.
For a homelab or small business running 10-50 containers, this trade-off is a clear win. You get centralized logging that runs comfortably on 512 MB of RAM.
Quick Comparison
| Feature | Loki | ELK Stack | Graylog |
|---|---|---|---|
| RAM (minimum) | 512 MB | 4-8 GB | 2-4 GB |
| Full-text indexing | No (label-based) | Yes | Yes |
| Query language | LogQL | KQL / Lucene | Custom |
| Grafana integration | Native | Via plugin | Separate UI |
| Complexity | Low | High | Medium |
| Cost at scale | Low | High | Medium |
Deploying Loki with Docker Compose
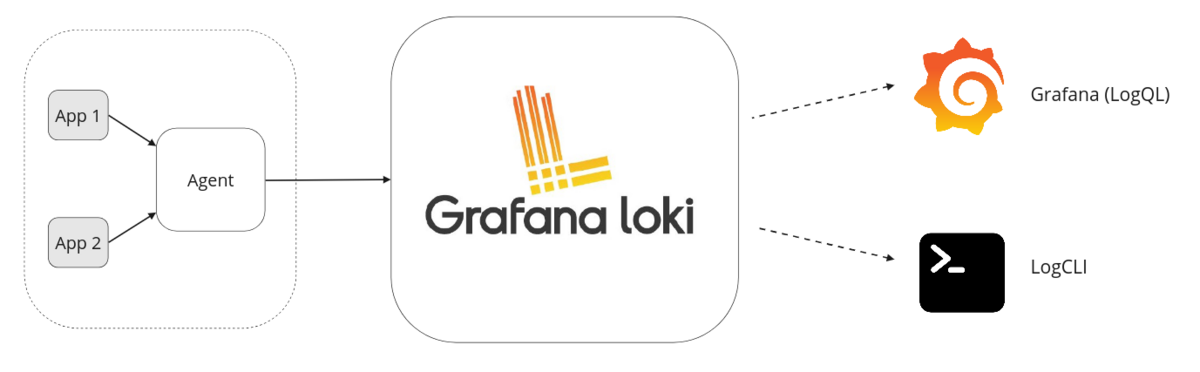
The standard Loki deployment has three components: Loki (the log store), Promtail (the log collector), and Grafana (the dashboard). Here is a complete Docker Compose setup that gets all three running.
version: "3.8"

services:
  loki:
    image: grafana/loki:3.4
    container_name: loki
    ports:
      - "3100:3100"
    volumes:
      - ./loki-config.yaml:/etc/loki/local-config.yaml
      - loki-data:/loki
    command: -config.file=/etc/loki/local-config.yaml
    restart: unless-stopped

  promtail:
    image: grafana/promtail:3.4
    container_name: promtail
    volumes:
      - ./promtail-config.yaml:/etc/promtail/config.yaml
      - /var/log:/var/log:ro
      - /var/lib/docker/containers:/var/lib/docker/containers:ro
      - /var/run/docker.sock:/var/run/docker.sock:ro
    command: -config.file=/etc/promtail/config.yaml
    restart: unless-stopped
    depends_on:
      - loki

  grafana:
    image: grafana/grafana:11.5
    container_name: grafana
    ports:
      - "3000:3000"
    volumes:
      - grafana-data:/var/lib/grafana
    environment:
      - GF_SECURITY_ADMIN_PASSWORD=changeme
    restart: unless-stopped
    depends_on:
      - loki

volumes:
  loki-data:
  grafana-data:
Configuring Loki
Create loki-config.yaml alongside your Compose file. This minimal configuration stores data locally and sets sensible retention:
auth_enabled: false

server:
  http_listen_port: 3100

common:
  path_prefix: /loki
  storage:
    filesystem:
      chunks_directory: /loki/chunks
      rules_directory: /loki/rules
  replication_factor: 1
  ring:
    kvstore:
      store: inmemory

schema_config:
  configs:
    - from: 2024-01-01
      store: tsdb
      object_store: filesystem
      schema: v13
      index:
        prefix: index_
        period: 24h

limits_config:
  retention_period: 30d

compactor:
  working_directory: /loki/compactor
  retention_enabled: true
Want more monitoring guides? Get guides like this in your inbox — Self-Hosted Weekly delivers one free deep-dive every week.
Configuring Promtail
Promtail is the agent that discovers log files and ships them to Loki. Create promtail-config.yaml:
server:
  http_listen_port: 9080

positions:
  filename: /tmp/positions.yaml

clients:
  - url: http://loki:3100/loki/api/v1/push

scrape_configs:
  # Discover Docker container logs
  - job_name: docker
    docker_sd_configs:
      - host: unix:///var/run/docker.sock
        refresh_interval: 5s
    relabel_configs:
      - source_labels: ['__meta_docker_container_name']
        target_label: container
        regex: '/(.+)'
      - source_labels: ['__meta_docker_container_log_stream']
        target_label: stream

  # System logs
  - job_name: system
    static_configs:
      - targets: [localhost]
        labels:
          job: syslog
          host: myserver
          __path__: /var/log/syslog
The Docker service discovery configuration automatically picks up logs from every running container. Each container gets labeled with its name, so you can filter logs per service in Grafana without any manual configuration. When you add a new container, Promtail starts collecting its logs within seconds.
Connecting Grafana to Loki
After running docker compose up -d, open Grafana at http://your-server:3000 and log in with the admin credentials from your Compose file.
- Navigate to Connections > Data Sources > Add data source
- Select Loki
- Set the URL to
http://loki:3100 - Click Save & Test -- you should see a green success message
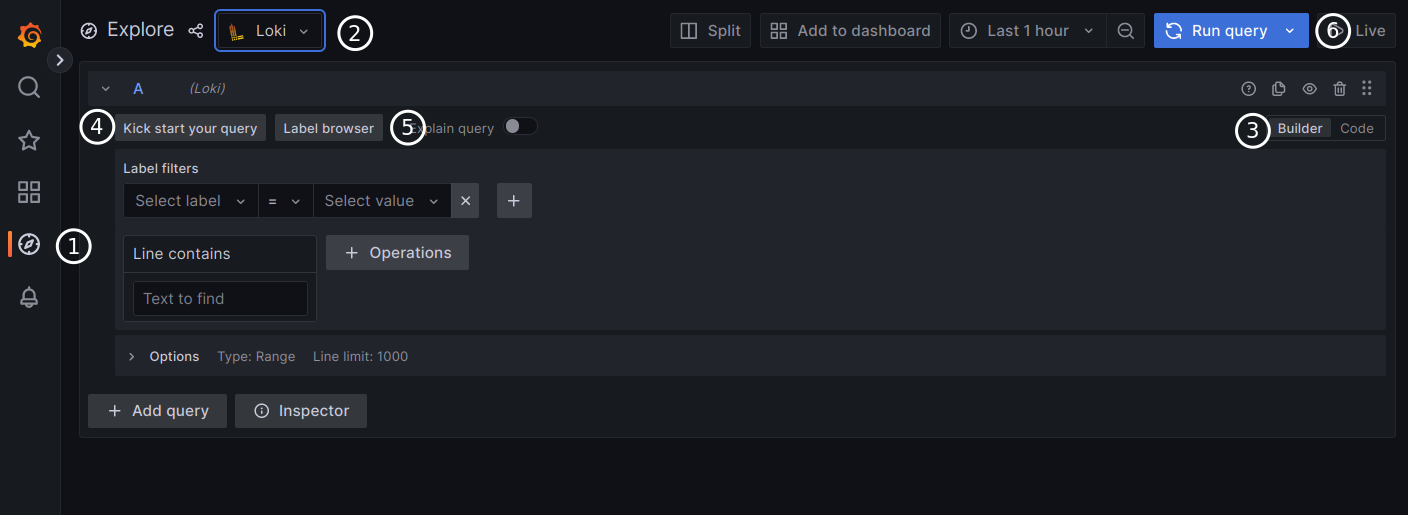
Now head to Explore in the sidebar. Select the Loki data source and you can start querying your logs immediately.
LogQL Basics
LogQL is Loki's query language. It looks similar to PromQL (if you use Prometheus) and follows a simple pattern: select log streams with labels, then optionally filter or transform the results.
Select all logs from a container:
{container="nginx"}
Filter for error lines:
{container="nginx"} |= "error"
Exclude health check noise:
{container="nginx"} != "/health"
Parse and filter structured logs:
{container="api"} | json | level="error" | line_format "{{.msg}}"
Count errors per minute (for dashboards):
rate({container="nginx"} |= "error" [1m])
The |= operator does a case-sensitive substring match. Use |~ for regex matching. The | json stage parses JSON log lines so you can filter on individual fields -- handy for structured logging from application containers.
Production Tips
Set retention early. Without retention configured, Loki stores logs forever. The config above sets a 30-day retention period. Adjust based on your available disk space -- a rough estimate is 5-10 GB per month for a typical homelab.
Use labels wisely. Loki performs best with a small number of label combinations. Good labels: container name, host, environment. Bad labels: user ID, request ID, or anything with high cardinality. High-cardinality labels create thousands of tiny streams and degrade performance.
Secure the endpoint. Loki's API has no built-in authentication. In the Compose setup above, port 3100 is exposed for convenience during setup. In production, remove the port mapping and let Grafana connect internally via the Docker network. If you need external access, put a reverse proxy with authentication in front of it.
Monitor Loki itself. Loki exposes Prometheus metrics at /metrics. If you run Prometheus, scrape Loki to track ingestion rates, query performance, and storage usage. Alerting on loki_ingester_streams_created_total helps catch label cardinality explosions early.
Back up the data volume. The loki-data Docker volume contains both your index and log chunks. Include it in your regular backup routine. If you lose it, you lose your log history.
Consider multi-host collection. If you have multiple servers, run Promtail on each one and point them all at the same Loki instance. Use a host label to distinguish which machine each log came from. For remote hosts, make sure the Loki endpoint is reachable over your network (a Tailnet or WireGuard mesh works well for this).
When Loki Is the Right Choice
Loki is ideal when you want centralized logging without dedicating significant resources to the logging infrastructure itself. If you are already running Grafana for dashboards and metrics, adding Loki is almost effortless -- it shares the same query patterns and integrates natively.
If you need full-text search across terabytes of logs, sub-second queries on massive datasets, or complex log analytics with aggregation pipelines, the ELK stack or Graylog may serve you better. But for the vast majority of self-hosted setups, Loki provides everything you need at a fraction of the cost and complexity.
Start with the Docker Compose setup above, point Promtail at your containers, and within minutes you will have every log from every service searchable in one place. The next time something breaks at 2 AM, you will have your answer in seconds instead of minutes.