
Beszel vs Netdata vs Glances: Choosing the Right Lightweight Monitoring Tool
You want to monitor your servers. You don't want to deploy Grafana + Prometheus + node_exporter + alertmanager and spend a weekend building dashboards. You want something lightweight that shows you CPU, memory, disk, and network -- preferably with a web interface and some kind of alerting.
Photo by Marc PEZIN on Unsplash
Three tools dominate this space: Beszel, Netdata, and Glances. All three are open source, all three are lightweight (compared to the Grafana stack), and all three can be running within minutes. But they serve different use cases, and picking the wrong one means either outgrowing it quickly or maintaining more complexity than you need.
This guide breaks down when to use each one.
Quick Overview
Beszel is a hub-and-agent monitoring system with a beautiful web dashboard. Install the hub on one server, deploy tiny agents on your other machines, and get a multi-server monitoring view. Minimal resource usage, minimal configuration.
Netdata is a feature-rich monitoring agent that auto-detects everything and gives you 2,000+ metrics with per-second granularity. Runs per-server by default but supports centralized viewing via Netdata Cloud or parent-child streaming.
Glances is a Python-based system monitor that works in the terminal, as a web server, and as an API. Think of it as htop on steroids -- with Docker support, export capabilities, and a plugin system.
Resource Usage
This is often the deciding factor for homelab users running on limited hardware.
| Metric | Beszel Agent | Beszel Hub | Netdata | Glances |
|---|---|---|---|---|
| RAM (idle) | ~10 MB | ~50 MB | ~150-300 MB | ~80-120 MB |
| CPU (idle) | <1% | <1% | 1-2% | <1% |
| Disk (data) | None (reports to hub) | ~100 MB/server/month | ~1 GB (configurable) | Minimal (no retention) |
| Binary size | ~10 MB | ~30 MB | ~100 MB | ~50 MB (Python) |
| Dependencies | None | None | None | Python 3 |
Beszel is the lightest option by a wide margin. The agent is a single 10 MB binary that uses negligible RAM. If you're running a Raspberry Pi or a VPS with 512 MB of memory, Beszel's agent footprint is almost invisible.
Netdata is heavier because it does more -- it collects thousands of metrics per second and maintains a local time-series database. On a server with 1+ GB of RAM, the overhead is acceptable. On a 512 MB Pi, it's noticeable.
Glances falls in between. It's a Python application, so it has some overhead from the Python runtime, but it doesn't maintain a large data store.
Feature Comparison
| Feature | Beszel | Netdata | Glances |
|---|---|---|---|
| Web dashboard | Yes (beautiful) | Yes (excellent) | Yes (basic) |
| Terminal UI | No | No | Yes (primary) |
| Multi-server | Yes (hub + agents) | Cloud or streaming | Client/server mode |
| Metrics count | ~20 per server | 2,000+ per server | ~50 per server |
| Per-second data | No (minutes) | Yes | Yes (display only) |
| Data retention | Weeks-months | Days-months (tiered) | None (real-time only) |
| Docker monitoring | Basic (CPU/mem) | Detailed | Yes (CPU/mem/net) |
| Auto-detection | Manual | Automatic (services, disks, etc.) | Automatic |
| Built-in alerts | Yes | Yes (hundreds) | Yes (via plugins) |
| API | Limited | Full REST API | Full REST API |
| Export to Prometheus | No | Yes | Yes |
| Custom dashboards | No | Limited | No |
| Mobile-friendly | Yes | Yes | Basic |
Want more monitoring guides? Get guides like this in your inbox — Self-Hosted Weekly delivers one free deep-dive every week.
Dashboards and UI
Beszel
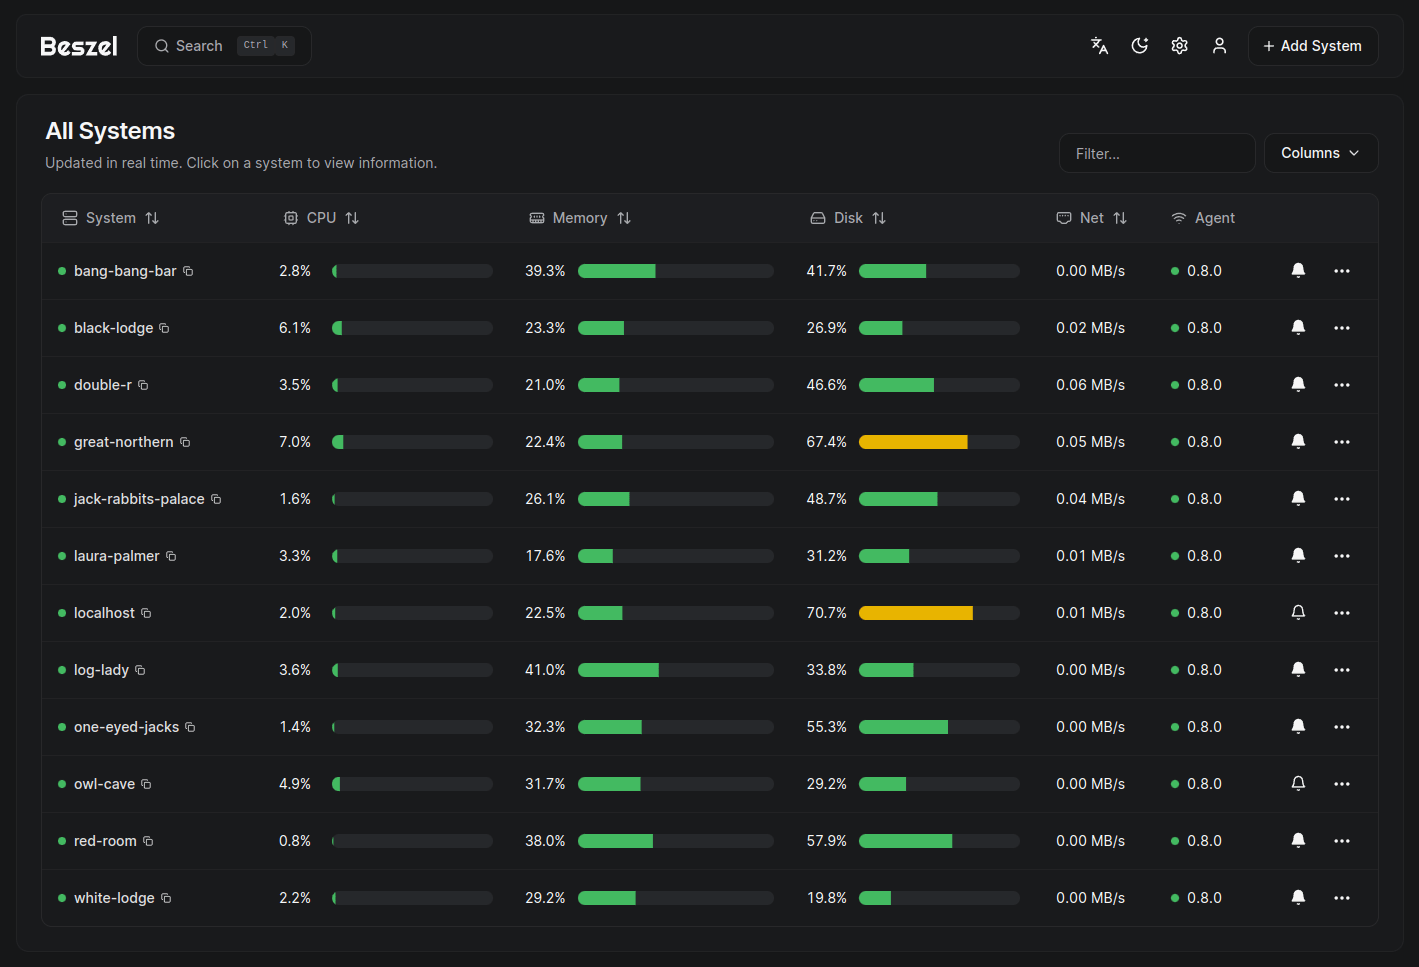
Beszel's dashboard is purpose-built and looks great without customization. The overview page shows all servers at a glance with color-coded health indicators. Drill into any server to see historical charts for CPU, memory, disk, and network.
The limitation: what you see is what you get. There's no way to add custom panels, change chart layouts, or visualize metrics that Beszel doesn't collect. For most homelab users, this is fine -- you want to know if things are healthy, not build a monitoring art gallery.
Netdata
Netdata's dashboard is the most feature-rich of the three. Thousands of charts organized into sections, with hover-syncing across all charts (hover over a CPU spike and every other chart jumps to the same timestamp). Zoom, pan, and anomaly highlighting are built in.
The sheer volume of data can be overwhelming. When you first open Netdata, you're looking at dozens of sections with hundreds of charts. But the search and filtering help, and after a few sessions you'll know exactly where to look.
Glances
Glances is primarily a terminal application -- the web UI is a secondary feature. The web interface renders the same data as the terminal view in a browser, but it's not as polished as Beszel or Netdata.
Where Glances excels: SSH into a server, run glances, and get a comprehensive overview immediately. No browser needed, no port to open. For quick troubleshooting, it's unbeatable.
Alerting
Beszel
Alerts are configured in the web UI per server:
- CPU usage threshold
- Memory usage threshold
- Disk usage threshold
- Temperature threshold
- Server offline detection
Notification channels: email (SMTP), webhooks (Discord, Slack, ntfy, Gotify).
Simple and effective, but limited to the metrics Beszel tracks.
Netdata
Netdata ships with hundreds of pre-configured alerts covering everything from disk space to network interface errors. Most users need to tune thresholds rather than create alerts from scratch.
Custom alerts use a declarative configuration:
alarm: high_cpu_usage
on: system.cpu
lookup: average -5m of user,system
warn: $this > 80
crit: $this > 95
info: CPU usage is high
Notification channels: email, Slack, Discord, PagerDuty, Telegram, ntfy, Gotify, Pushover, and more.
Glances
Glances has a threshold-based alert system configured in glances.conf:
[cpu]
careful=50
warning=70
critical=90
But the alert system is basic compared to Beszel and Netdata. There's no built-in email or webhook notification -- you'd need to script something around the Glances API or use the AMP (Action Monitoring Plugin) system.
Multi-Server Monitoring
Beszel: Built for It
Multi-server is Beszel's core design. Deploy agents, connect them to the hub, and you have a unified dashboard. The SSH-based transport means no special firewall rules beyond SSH access. This is the simplest multi-server setup of the three.
Netdata: Possible but Complex
Netdata has two multi-server approaches:
- Netdata Cloud -- Free tier, provides a unified dashboard across all your agents. Data stays on your servers (Cloud queries agents directly). Requires an account.
- Parent-child streaming -- Fully self-hosted. Configure child agents to stream to a parent agent. More complex to set up but no external dependency.
Neither is as simple as Beszel's hub-and-agent model.
Glances: Limited
Glances can run in client/server mode (glances -s on the server, glances -c <host> on the client), but this is designed for one-at-a-time viewing, not a unified dashboard. There's no multi-server overview.
Installation
Beszel
# Hub
services:
  beszel:
    image: henrygd/beszel:latest
    ports:
      - "8090:8090"
    volumes:
      - beszel_data:/beszel_data
    restart: unless-stopped
# Agent (on each server)
services:
  beszel-agent:
    image: henrygd/beszel-agent:latest
    network_mode: host
    volumes:
      - /var/run/docker.sock:/var/run/docker.sock:ro
    environment:
      - KEY=your-public-key-from-hub
      - PORT=45876
    restart: unless-stopped
Netdata
# One-line install
curl https://get.netdata.cloud/kickstart.sh > /tmp/netdata-kickstart.sh
sh /tmp/netdata-kickstart.sh --no-updates
Or Docker:
services:
  netdata:
    image: netdata/netdata:stable
    ports:
      - "19999:19999"
    cap_add:
      - SYS_PTRACE
      - SYS_ADMIN
    security_opt:
      - apparmor:unconfined
    volumes:
      - /proc:/host/proc:ro
      - /sys:/host/sys:ro
      - /var/run/docker.sock:/var/run/docker.sock:ro
    restart: unless-stopped
Glances
pip install glances[all]
glances  # Terminal mode
glances -w  # Web server mode (port 61208)
Or Docker:
services:
  glances:
    image: nicolargo/glances:latest
    ports:
      - "61208:61208"
    volumes:
      - /var/run/docker.sock:/var/run/docker.sock:ro
    environment:
      - GLANCES_OPT=-w
    pid: host
    restart: unless-stopped
When to Use Each
Choose Beszel When
- You monitor 2-10 servers and want a unified dashboard
- Minimal resource overhead matters (Raspberry Pis, low-memory VPS)
- You want something working in under 5 minutes
- Basic metrics (CPU, memory, disk, network, containers) are sufficient
- You don't need per-second granularity or thousands of metrics
Choose Netdata When
- You want deep visibility into a single server's performance
- You need to diagnose specific issues (which process is eating CPU, disk I/O latency, per-container network usage)
- You want anomaly detection to catch problems before they become outages
- You plan to export metrics to Prometheus/Grafana for long-term storage
- You're comfortable with ~200 MB RAM overhead per server
Choose Glances When
- You primarily work via SSH and want a better
htop - You need a quick diagnostic tool, not a persistent monitoring system
- You want an API to build custom monitoring scripts
- You're monitoring a single server and don't need historical data
- You want to export real-time data to InfluxDB, Prometheus, or other backends
Combine Them
These tools aren't mutually exclusive. A common setup:
- Beszel as the persistent multi-server dashboard (always running, low overhead)
- Glances installed on every server for ad-hoc SSH troubleshooting
- Netdata on your most critical server when you need deep diagnostic data
The Bottom Line
If you're monitoring multiple servers and want a clean dashboard with minimal overhead, start with Beszel. If you want maximum visibility into a single server with zero configuration, install Netdata. If you live in the terminal and want a powerful diagnostic tool, use Glances. All three install in minutes, all three are free, and none of them require you to learn PromQL or build Grafana dashboards. Pick the one that matches how you actually work, and you can always add another tool later if your needs change.