Beszel: Lightweight Server Monitoring with a Beautiful Dashboard
Beszel is a lightweight server monitoring tool that tracks CPU, memory, disk, network, and temperature across multiple servers with a clean, modern dashboard. It's built as a simpler alternative to Grafana+Prometheus — no time-series database configuration, no query languages, no dashboard building. Install the hub, deploy agents, and you immediately see your servers' health.
Photo by Nathan Anderson on Unsplash
Why Beszel?
The server monitoring space ranges from minimal (just run htop) to complex (Grafana + Prometheus + node_exporter + alertmanager). Beszel occupies the sweet spot:
- Simple setup — Single binary hub + lightweight agents
- Beautiful UI — Pre-built dashboard that looks good out of the box
- Multi-server — Monitor all your machines from one place
- Docker-aware — Shows per-container resource usage
- Alerts — Configurable notifications when thresholds are exceeded
- Low resource usage — Agent uses ~10 MB RAM, hub uses ~50 MB
- No external dependencies — No database to configure, SQLite built-in
The trade-off compared to Grafana: less customizable, shorter data retention, no custom dashboards. But for most self-hosters who just want to know "are my servers healthy?", Beszel gives you 90% of the value with 10% of the setup effort.
Architecture
Beszel has two components:
- Hub — The central dashboard. Runs on one server, stores data, serves the web UI
- Agent — A lightweight collector that runs on each monitored server and reports to the hub
Communication between agents and the hub uses SSH — no special firewall rules needed beyond SSH access.
Installation
Hub (Central Dashboard)
# docker-compose.yml
services:
  beszel:
    image: henrygd/beszel:latest
    container_name: beszel
    ports:
      - "8090:8090"
    volumes:
      - beszel_data:/beszel_data
    restart: unless-stopped

volumes:
  beszel_data:
docker compose up -d
Access the dashboard at http://your-server:8090 and create an admin account.
Agent (On Each Monitored Server)
The agent is a single binary. On each server you want to monitor:
Docker method:
services:
  beszel-agent:
    image: henrygd/beszel-agent:latest
    container_name: beszel-agent
    network_mode: host
    volumes:
      - /var/run/docker.sock:/var/run/docker.sock:ro
    environment:
      - KEY=your-public-key-from-hub
      - PORT=45876
    restart: unless-stopped
Binary method (no Docker):
curl -sL https://get.beszel.dev | bash
The agent is a single ~10 MB binary with no dependencies.
Connecting Agents to the Hub
- In the hub UI, click "Add Server"
- Enter the server's hostname/IP and the agent port (default 45876)
- Copy the public key shown and add it to the agent's
KEYenvironment variable - The hub connects to the agent via SSH and starts collecting data
Want more monitoring guides? Get guides like this in your inbox — Self-Hosted Weekly delivers one free deep-dive every week.
What It Monitors
System Metrics
- CPU — Usage percentage, per-core breakdown, temperature (if sensors available)
- Memory — Used, cached, available, swap
- Disk — Usage per mount point, I/O rates
- Network — Bandwidth per interface (upload/download)
- Temperature — CPU and GPU temperatures (requires lm-sensors on the host)
Docker Containers
When the Docker socket is mounted, the agent also reports:
- Per-container CPU usage
- Per-container memory usage
- Per-container network I/O
- Container status (running, stopped, etc.)
This is genuinely useful — you can see which container is eating your resources without SSH-ing in and running docker stats.
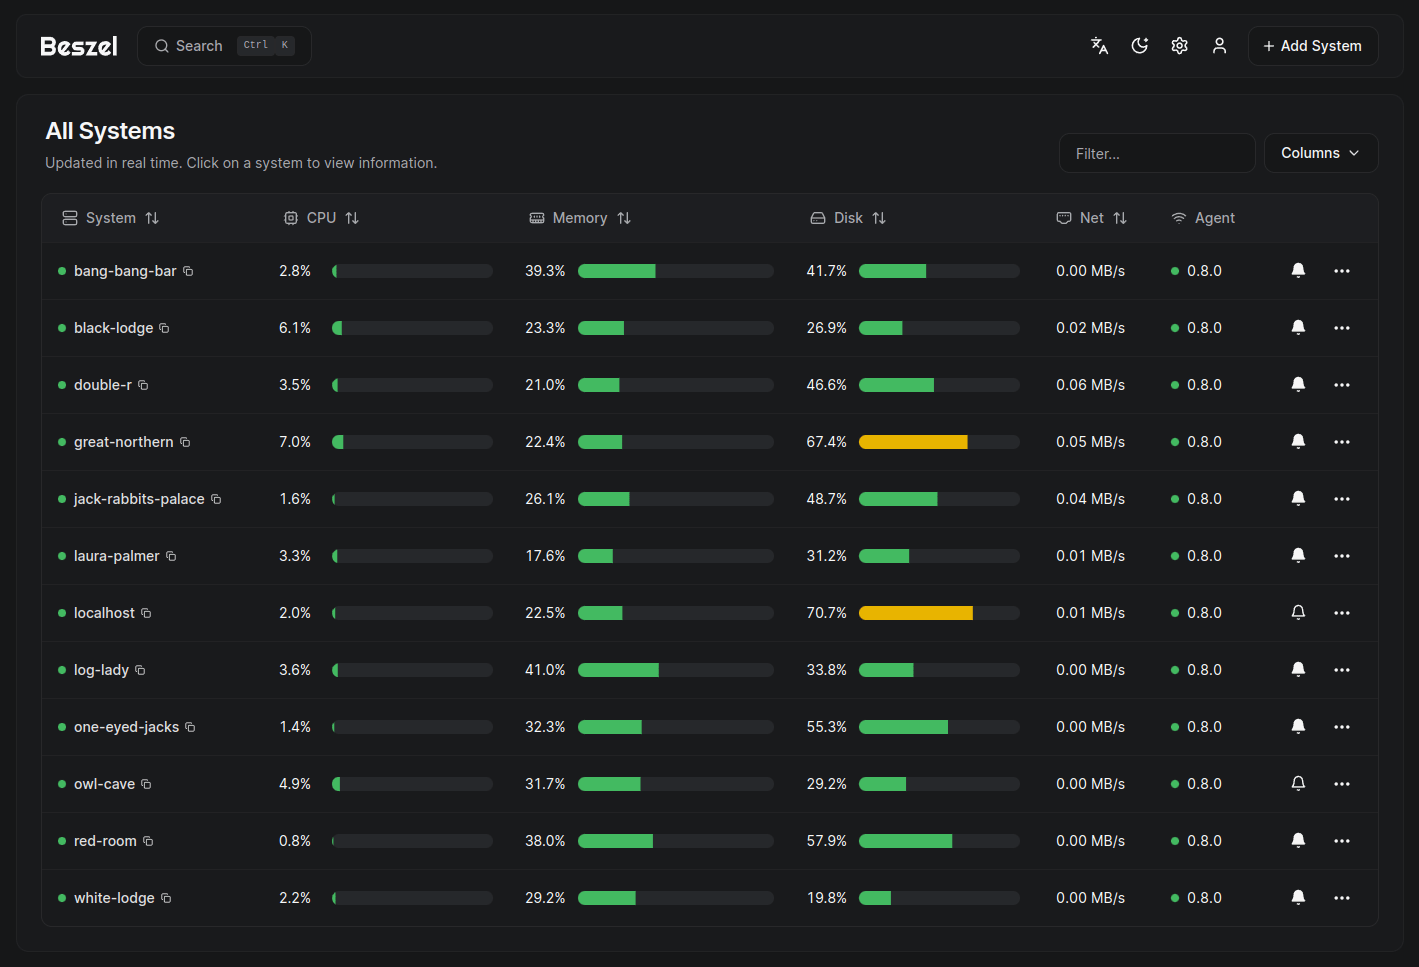
Dashboard Features
Overview Page
Shows all connected servers with:
- Current CPU and memory usage
- Connection status (online/offline)
- Uptime
- Quick visual indicators for health
Server Detail Page
Drill into any server to see:
- Historical graphs for all metrics (1h, 6h, 24h, 7d, 30d)
- Docker container breakdown
- Disk usage per mount
- Network traffic per interface
Alerts
Configure alerts in the hub UI:
- CPU — Alert when usage exceeds X% for Y minutes
- Memory — Alert when usage exceeds X%
- Disk — Alert when any mount exceeds X%
- Temperature — Alert when CPU temp exceeds X°C
- Status — Alert when a server goes offline
Alert channels:
- Email (SMTP)
- Webhook (Discord, Slack, ntfy, Gotify, etc.)
Beszel vs Netdata vs Grafana+Prometheus
| Feature | Beszel | Netdata | Grafana+Prometheus |
|---|---|---|---|
| Setup time | 5 minutes | 10 minutes | 30-60 minutes |
| Agent footprint | ~10 MB RAM | ~200 MB RAM | ~50 MB RAM |
| Hub footprint | ~50 MB RAM | Agent-based (no hub) | ~500 MB+ RAM |
| Pre-built dashboards | Yes | Yes (extensive) | No (build your own) |
| Custom dashboards | No | Limited | Unlimited |
| Data retention | Weeks/months | Hours/days | Configurable (years) |
| Query language | None | None | PromQL |
| Docker monitoring | Basic (CPU/mem) | Detailed | Detailed (with cAdvisor) |
| Learning curve | Very low | Low | High |
| Customization | Limited | Moderate | Unlimited |
Choose Beszel When
- You want a simple "are my servers healthy?" dashboard
- You monitor 1-10 servers
- You don't need custom dashboards or complex queries
- You want minimal resource overhead
Choose Netdata When
- You want extremely detailed metrics (thousands of charts)
- You need per-process monitoring
- You want anomaly detection
- Resource usage isn't a concern
Choose Grafana+Prometheus When
- You need long-term data retention (months/years)
- You want fully custom dashboards
- You need to correlate metrics from many sources
- You're monitoring a large infrastructure (10+ servers)
Tips
Monitoring Remote VPS Servers
If your hub and agent are on different networks, the SSH connection needs port 45876 accessible on the agent. Either:
- Open port 45876 in the firewall
- Use a Tailscale/WireGuard mesh network (recommended — keeps the agent off the public internet)
Reducing Data Storage
Beszel's SQLite database grows with data retention. If disk space is a concern:
- Reduce the retention period in settings
- More servers and shorter retention > fewer servers and longer retention
Using with Uptime Kuma
Beszel monitors server resources. Uptime Kuma monitors service availability. They complement each other:
- Beszel — "Is the server overloaded?"
- Uptime Kuma — "Is the service responding?"
- Together — "My service is down, and I can see the server ran out of memory"
Verdict
Beszel is the monitoring tool most self-hosters actually need. Not the monitoring tool they think they need (Grafana with 47 panels) — the one that takes five minutes to set up and immediately tells you if something is wrong.
The agent-hub architecture scales to a reasonable number of servers, the dashboard looks great without customization, and the Docker container monitoring answers the perennial question of "what's using all my RAM?" If you find yourself wanting more customization or longer retention later, you can always migrate to Grafana. But for most homelabs, Beszel is exactly enough.